Showing posts with label climate change. Show all posts

Monday, June 28, 2010

Scientific Expertise Lacking Among 'Doubters' of Climate Change, Says New Analysis


The small number of scientists who are unconvinced that human beings have contributed significantly to climate change have far less expertise and prominence in climate research compared with scientists who are convinced, according to a study led by Stanford researchers.

In a quantitative assessment -- the first of its kind to address this issue -- the team analyzed the number of research papers published by more than 900 climate researchers and the number of times their work was cited by other scientists.

"These are standard academic metrics used when universities are making hiring or tenure decisions," said William Anderegg, lead author of a paper published in the online Early Edition of Proceedings of the National Academy of Sciences this week.

Expertise was evaluated by the number of papers on climate research written by each individual, with a minimum of 20 required to be included in the analysis. Climate researchers who are convinced of human-caused climate change had on average about twice as many publications as the unconvinced, said Anderegg, a doctoral candidate in biology.

Prominence was assessed by taking the four most frequently cited papers published in any field by each scientist -- not just climate science publications -- and tallying the number of times those papers were cited by other researchers. Papers by climate researchers convinced of human effects were cited approximately 64 percent more often than papers by the unconvinced.

The scientists whose work was analyzed included all the researchers involved in producing the 2007 report of the Intergovernmental Panel on Climate Change working group that assessed the evidence for and against human involvement in climate change, as well as any climate researchers who signed a major public statement disagreeing with the findings of the panel's report.

The top 100

The Stanford team also determined the top 100 climate researchers, based on the total number of climate related publications each had, which produced an even more telling result, Anderegg said.

"When you look at the leading scientists who have made any sort of statement about anthropogenic (human-caused) climate change, you find 97 percent of those top 100 surveyed scientists explicitly agreeing with or endorsing the IPCC's assessment," he said. That result has been borne out by several other published studies that used different methodology, as well as some that are due out later this summer, he said.

"We really wanted to bring the expertise dimension into this whole discussion," Anderegg said. "We hope to put to rest the notion that keeps being repeated in the media and by some members of the public that 'the scientists disagree' about whether human activity is contributing to climate change."

"I never object to quoting opinions that are 'way out.' I think there is nothing wrong with that," said Stephen Schneider, professor of biology and a coauthor of the paper in Proceedings of the National Academy of Sciences. "But if the media doesn't report that something is a 'way out' opinion relative to the mainstream, then how is the average person going to know the relative credibility of what is being said?"

"It is sad that we even have to do this," said Schneider. "[Too much of] the media world has just folded up and fired its reporters with expertise in science."

The Stanford team is prepared for the doubters of anthropogenic climate change to object to their data.

"I think the most typical criticism of a paper like this -- not necessarily in academic discourse, but in the broader context -- is going to be that we haven't addressed if these sorts of differences could be due to some sort of clique or, at the extreme, a conspiracy of the researchers who are convinced of climate change," Anderegg said.

"When you stop to consider whether some sort of 'group think' really drives these patterns and could it really exist in science in general, the idea is really pretty laughable," he said. "All of the incentives in science are exactly the opposite.

"If you were a young researcher and had the data to overturn any of the mainstream paradigms, or what the IPCC has done, you would become absolutely famous," he said. "Everyone wants to be the next Darwin, everyone wants to be the next Einstein."

Schneider said that the team took pains to avoid any sort of prejudice or skewed data in their analysis. In selecting which of the researchers who signed petitions or statements disagreeing with the findings of the IPCC to include in the study, they omitted those who had no published papers in the climate literature.

"We only picked those who had at least some credentials in climate. So we went way beyond neutral, in their direction, bending over backward," Schneider said. "The doubters of anthropogenic climate change will claim foul anyway.

"They can say that climate researchers convinced of anthropogenic climate change are just trying to deny publication of the doubters' opinion, but let them go out and do a study to prove it," he said. "It is of course not true."

Stanford University (2010, June 27). Scientific expertise lacking among 'doubters' of climate change, says new analysis. ScienceDaily. Retrieved June 28, 2010, from http://www.sciencedaily.com/releases/2010/06/100625185428.htm

Tuesday, June 08, 2010

Coral atolls hold on despite sea-level rise


Some South Pacific coral atolls have held their own or even grown in size over the past 60 years despite rising sea levels, research showed Thursday.Some scientists worry that many of the tiny, low-lying islands throughout the South Pacific will eventually disappear under rising sea levels.But two researchers who measured 27 islands where local sea levels have risen 4.8 inches (120 millimeters) - an average of 0.08 inch (2 millimeters) a year - over the past 60 years, found just four had diminished in size.The reason: Coral islands respond to changes in weather patterns and climate, with coral debris eroded from encircling reefs pushed up onto the islands' coasts by winds and waves.Professor Paul Kench of Auckland University's environment school and coastal process expert Arthur Webb of the Fiji-based South Pacific Applied Geoscience Commission, used historical aerial photographs and high-resolution satellite images to study changes in the land area of the islands.While four had gotten smaller, the other 23 had either stayed the same or grown bigger, according to the research published in the scientific journal Global and Planetary Change.The shape-shifting islands changed their size through what the pair describe as ocean shoreline displacement toward their lagoons, lagoon shoreline growth or extensions to the ends of elongated islands.Kench said it had been assumed that islands would "sit there and drown" as sea levels rise. But as the sea rises, the islands respond."They're not all growing, they're changing. They've always changed ... but the consistency (with which) some of them have grown is a little surprising," he told The Associated Press on Thursday.Tuvalu, a coral island group that climate change campaigners have repeatedly predicted will be drowned by rising seas, has its highest point just 14 feet (4.5 meters) above sea level. The researchers found seven of its nine islands had grown by more than 3 percent on average over the past 60 years.In 1972, Cyclone Bebe dumped 346 acres (140 hectares) of sediment on the eastern reef of Tuvalu, increasing the area of Funafuti, the main island, by 10 percent. Another island, Funamanu, gained 1.1 acres (0.44 hectares) or nearly 30 percent of its previous area.A similar trend was found in Kiribati, where three main islands also "grew." Betio expanded by 30 percent (89 acres or 36 hectares), Bairiki by 16.3 percent (14 acres or 5.8 hectares), and Nanikai by 12.5 percent (2 acres, or 0.8 hectares).On World Environment Day in 2008, Kiribati President Anote Tong warned parts of his island nation were already being submerged, forcing some of Kiribati's 94,000 people living in shoreline village communities to be relocated from century-old sites.Worst case scenarios showed Kiribati would disappear into the sea within a century, he said at the time.But Kench said the study shows the islands are coping with sea-level change, with higher waves and water depth supplying sand and gravel from coral reefs."In other words, they (the islands) are slowly moving ... migrating across their reef platforms," he said. "As the sea-level conditions and wave conditions are changing, the islands are adjusting to that."But he warned an accelerated rate of sea-level rise could be "the critical environmental threat to the small island nations," with "a very rapid rate of island destruction" possible from a water depth beyond a certain threshold. That threshold is unknown.Australian sea level oceanographer John Hunter said the findings "are good news and not a surprise.""Coral islands can keep up with some sea-level rise, but (there's also) ocean warming ... and ocean acidification ... that are certainly problematic for the corals. Sea-level rise can actually make the islands grow - as it apparently is doing," said Hunter, who did not participate in the study.While coral might adjust to ocean warming, ocean acidification "will probably be the death knell of the coral reefs," leaving coastal management by humans as the only way of retaining and rebuilding atolls, said Hunter, a researcher at the University of Tasmania's Antarctic Climate and Ecosystems Cooperative Research Center.Commenting on the findings, New Scientist magazine noted, "Erosion of island shorelines must be reconsidered in the context of physical adjustments of the entire island shoreline, as erosion may be balanced by progradation on other sectors of shorelines."

Saturday, May 22, 2010

Ocean Stored Significant Warming Over Last 16 Years, Study Finds


The upper layer of the world's ocean has warmed since 1993, indicating a strong climate change signal, according to a new study. The energy stored is enough to power nearly 500 100-watt light bulbs per each of the roughly 6.7 billion people on the planet.

"We are seeing the global ocean store more heat than it gives off," said John Lyman, an oceanographer at NOAA's Joint Institute for Marine and Atmospheric Research, who led an international team of scientists that analyzed nine different estimates of heat content in the upper ocean from 1993 to 2008.

The team combined the estimates to assess the size and certainty of growing heat storage in the ocean. Their findings are published in the May 20 edition of the journal Nature. The scientists are from NOAA, NASA, the Met Office Hadley Centre in the United Kingdom, the University of Hamburg in Germany and the Meteorological Research Institute in Japan.

"The ocean is the biggest reservoir for heat in the climate system," said Josh Willis, an oceanographer at NASA's Jet Propulsion Laboratory and one of the scientists who contributed to the study. "So as the planet warms, we're finding that 80 to 90 percent of the increased heat ends up in the ocean."

A warming ocean is a direct cause of global sea level rise, since seawater expands and takes up more space as it heats up. The scientists say that this expansion accounts for about one-third to one-half of global sea level rise.

Combining multiple estimates of heat in the upper ocean -- from the surface to about 2,000 feet down -- the team found a strong multi-year warming trend throughout the world's ocean. According to measurements by an array of autonomous free-floating ocean floats called Argo as well as by earlier devices called expendable bathythermographs or XBTs that were dropped from ships to obtain temperature data, ocean heat content has increased over the last 16 years.

The team notes that there are still some uncertainties and some biases.

"The XBT data give us vital information about past changes in the ocean, but they are not as accurate as the more recent Argo data," said Gregory Johnson, an oceanographer at NOAA's Pacific Marine Environmental Laboratory. "However, our analysis of these data gives us confidence that on average, the ocean has warmed over the past decade and a half, signaling a climate imbalance."

Data from the array of Argo floats­ -- deployed by NOAA and other U.S. and international partners ­- greatly reduce the uncertainties in estimates of ocean heat content over the past several years, the team said. There are now more than 3,200 Argo floats distributed throughout the world's ocean sending back information via satellite on temperature, salinity, currents and other ocean properties.

ohn M. Lyman, Simon A. Good, Viktor V. Gouretski, Masayoshi Ishii, Gregory C. Johnson, Matthew D. Palmer, Doug M. Smith, Josh K. Willis. Robust warming of the global upper ocean. Nature, 2010; 465 (7296): 334 DOI: 10.1038/nature09043

Friday, April 16, 2010

Massive Arctic Ice Cap Is Shrinking, Study Shows; Rate Accelerating Since 1985


Close to 50 years of data show the Devon Island ice cap, one of the largest ice masses in the Canadian High Arctic, is thinning and shrinking.


A paper published in the March edition of Arctic, the journal of the University of Calgary's Arctic Institute of North America, reports that between 1961 and 1985, the ice cap grew in some years and shrank in others, resulting in an overall loss of mass. But that changed 1985 when scientists began to see a steady decline in ice volume and area each year.
"We've been seeing more mass loss since 1985," says Sarah Boon, lead author on the paper and a Geography Professor at the University of Lethbridge. The reason for the change? Warmer summers.
The High Arctic is essentially a desert with low rates of annual precipitation. There is little accumulation of snow in the winter and cool summers, with temperatures at or below freezing, serve to maintain levels. Any increase of snow and ice takes years.
This delicate equilibrium is easily upset. One warm summer can wipe out five years of growth. And though the accelerated melting trend began in 1985, the last decade has seen four years with unusually warm summers -- 2001, 2005, 2007 and 2008.
"What we see during these warm summers is the extent of the melt is greater," says Boon about the results of a five-year remote sensing study that ran between 2000 and 2004.
The white surfaces of snow and ice reflect heat -- a process known as the albedo effect. Retreating ice exposes dark soil and gravel, which absorb heat and increase the melt rate of ice along the periphery of the cap. But it's not only the edges of the cap that are losing ice. At lower altitudes the ice is thinning as well.
Changes to the Devon ice cap, which covers approximately 14,400 sq. km, could have multiple impacts on everything from ship traffic to sea level.
There has already been an increase in the number of icebergs calving off from outlet glaciers that flow into the ocean. Boon explains that melt water runs between the bottom of the glacier and the ground, creating a slippery cushion that allows the glacier to slide forward more rapidly than it would in colder conditions.
"There are a lot of things we need to consider. One is the iceberg calving and its implications for shipping. These things don't just go away, they float out into the ocean," says Boon. A second area of concern is the contribution of increased glacier melt to rising sea level.
The work of Boon and her colleagues demonstrates the importance of long-term research. Work on Devon Island began in 1961 with researchers from the Arctic Institute of North America, including long-time Arctic scientist Roy 'Fritz' Koerner, who was part of the current study until his death in 2008. This ongoing research, which is continuing thanks to federal International Polar year funding, has created a comprehensive dataset that contributes to the understanding of the complex play between the ice cap, the atmosphere and the ocean.
"We all know long-term studies are important but they are really hard to pay for."

Arctic Institute of North America (2010, April 13). Massive Arctic ice cap is shrinking, study shows; Rate accelerating since 1985.

Thursday, April 01, 2010

Ice Sheet Melt Identified as Trigger of 'Big Freeze'


The main cause of a rapid global cooling period, known as the Big Freeze or Younger Dryas -- which occurred nearly 13,000 years ago -- has been identified thanks to the help of an academic at the University of Sheffield.


A new paper, which is published in Nature on April 1, 2010, has identified a mega-flood path across North America which channelled melt-water from a giant ice sheet into the oceans and triggering the Younger Dryas cold snap.
The research team, which included Dr Mark Bateman from the University of Sheffield's Department of Geography, discovered that a mega-flood, caused by the melting of the Laurentide ice sheet, which covered much of North America, was routed up into Canada and into the Arctic Ocean.
This resulted in huge amounts of fresh water mixing with the salt water of the Arctic Ocean. As a result, more sea-ice was created which flowed into the North Atlantic, causing the northward continuation of the Gulf Stream to shut down.
Without the heat being brought across the Atlantic by the Gulf Stream, temperatures in Europe plunged from similar to what they are today, back to glacial temperatures with average winter temperatures of -25oC. This cooling event has become known as the Younger Dryas period with cold conditions lasting about 1400 years. The cold of the Younger Dryas affected many places across the continent, including Yorkshire in the Vale of York and North Lincolnshire which became arctic deserts with sand dunes and no vegetation.
Before now, scientists have speculated that the mega-flood was the main cause of the abrupt cooling period, but the path of the flood waters has long been debated and no convincing evidence had been found establishing a route from the ice-sheet to the North Atlantic.
The research team studied a large number of cliff sections along the Mackenzie Delta and examined the sediments within them. They found that many of the cliff sections showed evidence of sediment erosion. This evidence spanned over a large region at many altitudes, which could only be explained by a mega-flood from the over-spilling of Lake Agassiz, which was at times bigger than the UK, at the front of the Laurentide Ice-sheet rather than a normal flood of the river.
Dr Bateman, who has been researching past environmental changes both in the UK and elsewhere in the world for almost 20 years, runs the luminescence dating lab at Sheffield. The lab was able to take the MacKenzie Delta sediment samples from above and below the mega-flood deposits, and find out when the mega-flood occurred, enabling its occurrence to be attributed to the start of the Younger Dryas.
The study will help shed light on the implications of fresh water input into the North Atlantic today. There are current concerns that changes in the salinity of the ocean today, could cause another shut down of the Gulf Stream. Current climate changes, including global warming, may be altering the planetary system which regulates evaporation and precipitation, and moves fresh water around the globe.
The findings, which show the cause, location, timing and magnitude of the mega-flood, will enable scientists to better understand how sensitive both oceans and climates are to fresh-water inputs and the potential climate changes which may ensue if the North Atlantic continues to alter.
Dr Mark Bateman, from the University of Sheffield's Centre for International Drylands Research at the Department of Geography, said: "The findings of this paper through the combination of luminescence dating, landscape elevation models and sedimentary evidence allows an insight into what must have been one of the most catastrophic geological events in recent earth's history. They also show how events within the Earth-climate system in North America had huge impacts in Europe."
Julian B. Murton, Mark D. Bateman, Scott R. Dallimore, James T. Teller, Zhirong Yang. Identification of Younger Dryas outburst flood path from Lake Agassiz to the Arctic Ocean. Nature, 2010; 464 (7289): 740 DOI: 10.1038/nature08954

Vital Role for Bacteria in Climate-Change Gas Cycle


Isoprene is a Jekyll-and-Hyde gas that is capable of both warming and cooling the Earth depending on the prevailing conditions. It is an important industrial gas, necessary for the manufacture of important compounds such as rubber and vitamins, but very little is known about how isoprene is cycled in the environment.


At the Society for General Microbiology's spring meeting in Edinburgh, Dr Terry McGenity revealed the identity of some crucial players in the gas cycle; isoprene-degrading bacteria that are able to intercept the release of isoprene into the atmosphere.
After being released by plants and algae, isoprene reacts with molecules in the atmosphere to produce ozone. It can also prolong the lifetime of methane in the air. Both ozone and methane are potent greenhouse gases that lead to global warming. Conversely, in certain conditions, isoprene can undergo chemical reactions to form aerosols that can increase cloud cover leading to cooling of the Earth.
Together with colleagues at the University of Essex, Dr McGenity discovered that that there are numerous types of bacteria able to consume isoprene before it even enters the atmosphere. These bacteria were found concentrated around coastal zones that are known to be hot spots of marine isoprene production by algae.
"The discovery will improve models that help us to predict how climate change and other environmental factors affect isoprene flux and vice versa," said Dr McGenity. "Until now modelling the overall flow of isoprene from the sea to the atmosphere has been hampered by inadequate understanding of the main producers and consumers," he explained.
Interestingly, many of the isoprene-degrading bacteria can also break down alkanes (a major component of crude oil). "This suggests that algal-derived isoprene may help important oil-degrading microbes to survive between spills," explained Dr McGenity.
An understanding of how isoprene is naturally cycled in the environment could have important applications across different industries. "Currently the chemical industry relies on isoprene derived from crude oil as a building block for the manufacture of compounds like vitamins and rubber, whereas algae could potentially provide a sustainable supply of isoprene for these uses." suggested Dr McGenity. "Equally, studying the enzymes involved in bacterial isoprene metabolism may lead to applications in the synthesis of important pharmaceuticals," he said. Society for General Microbiology (2010, March 30). Vital role for bacteria in climate-change gas cycle. ScienceDaily. Retrieved April 1, 2010, from http://www.sciencedaily.com­ /releases/2010/03/100329203226.htm

Saturday, March 13, 2010

Aquatic 'Dead Zones' Contributing to Climate Change


The increased frequency and intensity of oxygen-deprived "dead zones" along the world's coasts can negatively impact environmental conditions in far more than just local waters. In the March 12 edition of the journalScience, University of Maryland Center for Environmental Science oceanographer Dr. Lou Codispoti explains that the increased amount of nitrous oxide (N2O) produced in low-oxygen (hypoxic) waters can elevate concentrations in the atmosphere, further exacerbating the impacts of global warming and contributing to ozone "holes" that cause an increase in our exposure to harmful UV radiation.

"As the volume of hypoxic waters move towards the sea surface and expands along our coasts, their ability to produce the greenhouse gas nitrous oxide increases," explains Dr. Codispoti of the UMCES Horn Point Laboratory. "With low-oxygen waters currently producing about half of the ocean's net nitrous oxide, we could see an additional significant atmospheric increase if these 'dead zones' continue to expand."

Although present in minute concentrations in Earth's atmosphere, nitrous oxide is a highly potent greenhouse gas and is becoming a key factor in stratospheric ozone destruction. For the past 400,000 years, changes in atmospheric N2O appear to have roughly paralleled changes in carbon dioxide CO2 and have had modest impacts on climate, but this may change. Just as human activities may be causing an unprecedented rise in the terrestrial N2O sources, marine N2O production may also rise substantially as a result of nutrient pollution, warming waters and ocean acidification. Because the marine environment is a net producer of N2O, much of this production will be lost to the atmosphere, thus further intensifying its climatic impact.

Increased N2O production occurs as dissolved oxygen levels decline. Under well-oxygenated conditions, microbes produce N2O at low rates. But at oxygen concentrations decrease to hypoxic levels, these waters can increase their production of N2O.

N2O production rates are particularly high in shallow suboxic and hypoxic waters because respiration and biological turnover rates are higher near the sunlit waters where phytoplankton produce the fuel for respiration.

When suboxic waters (oxygen essentially absent) occur at depths of less than 300 feet, the combination of high respiration rates, and the peculiarities of a process called denitrification can cause N2O production rates to be 10,000 times higher than the average for the open ocean. The future of marine N2O production depends critically on what will happen to the roughly ten percent of the ocean volume that is hypoxic and suboxic.

"Nitrous oxide data from many coastal zones that contain low oxygen waters are sparse, including Chesapeake Bay," said Dr. Codispoti. "We should intensify our observations of the relationship between low oxygen concentrations and nitrous oxide in coastal waters."

Thursday, March 11, 2010

Impacts of Changing Climate on Ocean Biology


A three-year field program now underway is measuring carbon distributions and primary productivity in the Northwest Atlantic Ocean to help scientists worldwide determine the impacts of a changing climate on ocean biology and biogeochemistry. The study, Climate Variability on the East Coast (CliVEC), will also help validate ocean color satellite measurements and refine biogeochemistry models of ocean processes.

Researchers from NOAA, NASA and Old Dominion University are collaborating through an existing NOAA Fisheries Service field program, the Ecosystem Monitoring or EcoMon program. The EcoMon surveys are conducted six times each year by the Northeast Fisheries Science Center (NEFSC) at 120 randomly selected stations throughout the continental shelf and slope of the northeastern U.S., from Cape Hatteras, N.C., into Canadian waters to cover all of Georges Bank and the Gulf of Maine. This area is known as the Northeast U.S. continental shelf Large Marine Ecosystem.

The climate study team will participate in three annual EcoMon cruises aboard the 155-foot NOAA Fisheries Survey VesselDelaware II, based at the NEFSC's laboratory in Woods Hole, Mass. The most recent cruise returned to Woods Hole on February 18.

Findings from the climate impact project, funded by NASA, will help scientists better understand how annual and decadal-scale climate variability affects the growth of phytoplankton, which is the basis of the oceanic food chain. The project will also examine organic carbon distributions along the continental margin of the East Coast and collect data for ocean acidification studies.

John O'Reilly of the satellite ocean productivity group and Kimberly Hyde of the ecosystem assessment program at NEFSC's Narragansett, R.I., laboratory are co-principal investigators on the CliVEC project. Laboratory colleague Jon Hare, an oceanographer and plankton specialist, oversees the EcoMon program and is a collaborator on the new climate study.

"The CliVEC program will provide a more complete understanding of the northeast U.S. shelf ecosystem," said Hare. "It extends our EcoMon survey efforts, and we are excited about the new knowledge and advances in satellite models that we will all gain from this collaboration and pooling of resources."

O'Reilly has had a long collaboration with NASA scientists in developing algorithms for processing data from ocean color remote sensors on satellites that provide global maps of ocean surface characteristics. The satellite-transmitted data can also be used to develop oceanic primary production models and algorithms that measure carbon distributions in the ocean.

Other lead investigators in the CliVEC project include Antonio Mannino from NASA's Goddard Space Flight Center (GSFC), Margaret Mulholland from Old Dominion University (ODU), and David Lary from the NASA-affiliated University of Maryland Baltimore County Joint Center for Earth Systems Technology. The team of scientists from GSFC and ODU is conducting water sampling and experiments to quantify primary productivity and carbon distributions.

"Phytoplankton are the foundation of the food chain in the ocean and produce about half of the oxygen on Earth," said Mannino. "By understanding the distribution of phytoplankton populations and how they react to natural and anthropogenic forcing, we can better predict future responses of phytoplankton and possibly even fisheries."

The Northwest Atlantic location was chosen for the CliVEC study because it is the crossroads between major ocean circulation features like the Gulf Stream and the Labrador Current.

Discharges from rivers, seasonal changes in water column density stratification, the freshening of surface waters from melting of the Greenland ice sheet, and other climate-related factors can all alter ocean circulation patterns and affect the strength, timing and location of phytoplankton blooms, potentially decreasing annual primary production and changing ocean biology.

Scientific activities during the recent 18-day cruise included collecting water samples from the surface to the ocean floor for a variety of chemical measurements, and sampling to identify the incursion of Labrador Current water into the Gulf of Maine. Instruments were also deployed to measure sea surface temperatures and salinities and to collect data on chlorophyll, oxygen and nitrate levels, and the depth of light transmission for primary productivity.

In addition to the CliVEC activities, zooplankton samples were collected for the Census of Marine Zooplankton Project. Standard EcoMon sampling was also done, extending oceanographic and plankton time series that started in the early 1970s. Two observers were aboard to identify and count seabirds, and sightings of northern right whales and other whale species were recorded.Adapted from materials provided by NOAA Fisheries Northeast Fisheries Science Center.

Wednesday, March 03, 2010

Understanding Global Climate Change Through Polar Research

The latest findings from research on Antarctica's rich marine life are presented this week at the American Association for the Advancement of Science (AAAS). Marine Biologist Huw Griffiths from British Antarctic Survey (BAS) is involved in a major international investigation into the distribution and abundance of Antarctica's vast marine biodiversity -- the Census of Antarctic Marine Life (CAML).Griffiths presents results from the census -- which began in 2005 -- and describes how the investigation provides the benchmark for future studies on how the extraordinary and diverse range of sea-floor creatures living in Antarctica's chilly waters will respond to predicted environmental change.More than 6,000 different species living on the sea-floor have been identified so far and more than half of these are unique to the icy continent. A combination of long-term monitoring studies, newly gathered information on the marine life distribution and global ocean warming models, enable the scientists to identify Antarctica's marine 'biodiversity hotspots'.Griffiths describes how krill populations (the shrimp-like invertebrates eaten by penguins, whales and seals) are reducing as a result of a decrease in sea-ice cover. A much smaller crustacean (copepods) is dominating the area once occupied by them. This shifts the balance of the food web to favour predators, like jellyfish, that are not eaten by penguins and other Southern Ocean higher predators. Sea-ice reduction is also affecting penguins that breed on the ice.Griffiths says, "The Polar Regions are amongst the fastest warming places on Earth and predictions suggest that in the future we'll see warming sea surface temperatures, rising ocean acidification and decreasing winter sea ice -- all of which have a direct effect on marine life."Marine animals spent millions of years adapting to the freezing, stable conditions of the Antarctic waters and they are highly sensitive to change. This means that from the scientist's perspective they are excellent indicators of environmental change. The polar oceans are rich in biodiversity. If species are unable to move or adapt to new conditions they could ultimately die out. The loss of any unique species is therefore a loss of global diversity."

Tuesday, March 02, 2010

Understanding Global Climate Change Through New Breakthroughs in Polar Research

The latest findings from research on Antarctica's rich marine life are presented this week at the American Association for the Advancement of Science (AAAS). Marine Biologist Huw Griffiths from British Antarctic Survey (BAS) is involved in a major international investigation into the distribution and abundance of Antarctica's vast marine biodiversity -- the Census of Antarctic Marine Life (CAML).
Griffiths presents results from the census -- which began in 2005 -- and describes how the investigation provides the benchmark for future studies on how the extraordinary and diverse range of sea-floor creatures living in Antarctica's chilly waters will respond to predicted environmental change.
More than 6,000 different species living on the sea-floor have been identified so far and more than half of these are unique to the icy continent. A combination of long-term monitoring studies, newly gathered information on the marine life distribution and global ocean warming models, enable the scientists to identify Antarctica's marine 'biodiversity hotspots'.
Griffiths describes how krill populations (the shrimp-like invertebrates eaten by penguins, whales and seals) are reducing as a result of a decrease in sea-ice cover. A much smaller crustacean (copepods) is dominating the area once occupied by them. This shifts the balance of the food web to favour predators, like jellyfish, that are not eaten by penguins and other Southern Ocean higher predators. Sea-ice reduction is also affecting penguins that breed on the ice.
Griffiths says, "The Polar Regions are amongst the fastest warming places on Earth and predictions suggest that in the future we'll see warming sea surface temperatures, rising ocean acidification and decreasing winter sea ice -- all of which have a direct effect on marine life.
"Marine animals spent millions of years adapting to the freezing, stable conditions of the Antarctic waters and they are highly sensitive to change. This means that from the scientist's perspective they are excellent indicators of environmental change. The polar oceans are rich in biodiversity. If species are unable to move or adapt to new conditions they could ultimately die out. The loss of any unique species is therefore a loss of global diversity."

Climate Change and Coral Reefs: Coral Species Has Developed the 'Skills' to Cope With Rising Temperatures


Move, adapt or die. Those are the options marine plants and animals have in the face of climate change, said Stanford biologist Steve Palumbi, who has been exploring how to help them go with the first two options, rather than the third. He's come up with some surprising answers.


Palumbi discussed the results of his research in two talks at the annual meeting of the American Association for the Advancement of Science in San Diego.
How to design marine protected areas to best benefit a wide variety of plant and animal species is the focus of a talk he gave on Feb. 20. The most practical kind of natural reserve is one that benefits species and local human populations, but Palumbi said striking that balance isn't always easy. Many people have argued that bigger is better when it comes to marine reserves, but Palumbi has data suggesting that is not always the case.
In a separate Topical Lecture he gave on Feb. 21, Palumbi presented his findings on how marine species are reacting to climate change, including new work on coral species in the Pacific that have poor powers of dispersal but a surprising ability to cope with higher temperatures.
Palumbi is director of Stanford's Hopkins Marine Station and a senior fellow at the university's Woods Institute for the Environment.
If you can't move, then you'd better adjust
Many species, such as those along the west coast of California, can simply migrate north to colder waters. But other animals, such as the coral that Palumbi's team has studied in Fiji and American Samoa, won't be moving anytime soon.
"Each coral population is trapped on its own island, and as global climate changes around them, the populations are essentially stuck where they are. They have to go to the second stage, which is to adapt," Palumbi said.
Marine scientists have predicted that coral reefs will be at risk of extinction due to high ocean temperatures caused by climate change, but Palumbi has found a species of coral that may have a better chance of adapting.
Palumbi's team studied corals growing in shallow lagoons that face intense heat during noontime summer low tides. The team knew these corals were resistant to brief heating but were surprised to find that the corals survived five to six days of high water temperatures. Baking in the tropical summer sun at low tide for 4 to 6 hours a day seems to have better prepared these corals for global warming temperatures.
"When we tested these corals against high temperatures for extended periods of time, they showed all the evidence of having higher resilience," Palumbi said. "It looks like the corals have adapted or acclimated to that stress and have a better chance of resisting high global warming temperatures." How long this resilience will last, and whether all corals can do this, are remaining questions.
Does size matter for marine reserves?
A major response to climate change is to protect reefs from other human-caused stresses such as overfishing. And as a result, a large number of Marine Protected Areas have been implemented in the Pacific. Some are the size of a football field. Some are the size of California. Is bigger better?
To determine how much difference the size of a protected area might make, Palumbi analyzed data from a set of small reserves in Fiji, from the Phoenix Islands and from the Papahanaumokuakea Reserve in Hawaii, the largest marine reserve in the world. All three areas are set aside by government agencies.
The Papahanaumokuakea Marine National Monument covers 360,000 square kilometers (139,000 square miles) in Northwest Hawaii and is a "no-take" reserve, which means nothing may be removed, including fish.
The Phoenix Islands Protected Area, which lies in the central Pacific Ocean between Hawaii and Fiji, is over 408,000 square kilometers (158,000 square miles). There are seven no-take reserves in this area, each about 39 kilometers (24 miles) across.
However, in densely populated areas, smaller reserves are more common. Fiji has 246 such protected areas, each averaging about 2 to 3 square kilometers (about a square mile).
"Small sets of marine protected areas are much more convenient: People can fish in between them or go around them easily. Species found within the marine protected areas easily spill out into the surrounding areas, potentially increasing fishing productivity," Palumbi said.
However, wide stretches of protected ocean allow species to spread more easily than small areas, where they risk being caught by fishermen between the reserves. Therefore, small reserves must be well matched to the plants and animals they are protecting because each species spreads at different rates, Palumbi said.
"Species have lots of different dispersal abilities, so it's very hard to have a marine protected area network that works equally well for all different species. You have to tailor the network of reserves to the species," he said.
Though small reserves meet the needs of fewer species than those of larger reserves, setting aside enormous areas of ocean is not that simple. Scientists and policymakers must consider local residents who depend on fisheries for their well-being.
"With heavy human populations, the political, social and economic problems of a big marine protected area are paramount and you've got to go to another strategy. But it's a strategy with limitations because it's hard to design an area perfectly for all species that need protection," Palumbi said. The most effective reserve is one that balances preservation of species with human needs, he said. Finding that balance is the challenge.

Friday, February 26, 2010

Researchers Measure Impacts of Changing Climate on Ocean Biology


A three-year field program now underway is measuring carbon distributions and primary productivity in the Northwest Atlantic Ocean to help scientists worldwide determine the impacts of a changing climate on ocean biology and biogeochemistry. The study, Climate Variability on the East Coast (CliVEC), will also help validate ocean color satellite measurements and refine biogeochemistry models of ocean processes.Researchers from NOAA, NASA and Old Dominion University are collaborating through an existing NOAA Fisheries Service field program, the Ecosystem Monitoring or EcoMon program. The EcoMon surveys are conducted six times each year by the Northeast Fisheries Science Center (NEFSC) at 120 randomly selected stations throughout the continental shelf and slope of the northeastern U.S., from Cape Hatteras, N.C., into Canadian waters to cover all of Georges Bank and the Gulf of Maine. This area is known as the Northeast U.S. continental shelf Large Marine Ecosystem.The climate study team will participate in three annual EcoMon cruises aboard the 155-foot NOAA Fisheries Survey Vessel Delaware II, based at the NEFSC's laboratory in Woods Hole, Mass. The most recent cruise returned to Woods Hole on February 18.Findings from the climate impact project, funded by NASA, will help scientists better understand how annual and decadal-scale climate variability affects the growth of phytoplankton, which is the basis of the oceanic food chain. The project will also examine organic carbon distributions along the continental margin of the East Coast and collect data for ocean acidification studies.John O'Reilly of the satellite ocean productivity group and Kimberly Hyde of the ecosystem assessment program at NEFSC's Narragansett, R.I., laboratory are co-principal investigators on the CliVEC project. Laboratory colleague Jon Hare, an oceanographer and plankton specialist, oversees the EcoMon program and is a collaborator on the new climate study."The CliVEC program will provide a more complete understanding of the northeast U.S. shelf ecosystem," said Hare. "It extends our EcoMon survey efforts, and we are excited about the new knowledge and advances in satellite models that we will all gain from this collaboration and pooling of resources."O'Reilly has had a long collaboration with NASA scientists in developing algorithms for processing data from ocean color remote sensors on satellites that provide global maps of ocean surface characteristics. The satellite-transmitted data can also be used to develop oceanic primary production models and algorithms that measure carbon distributions in the ocean.Other lead investigators in the CliVEC project include Antonio Mannino from NASA's Goddard Space Flight Center (GSFC), Margaret Mulholland from Old Dominion University (ODU), and David Lary from the NASA-affiliated University of Maryland Baltimore County Joint Center for Earth Systems Technology. The team of scientists from GSFC and ODU is conducting water sampling and experiments to quantify primary productivity and carbon distributions."Phytoplankton are the foundation of the food chain in the ocean and produce about half of the oxygen on Earth," said Mannino. "By understanding the distribution of phytoplankton populations and how they react to natural and anthropogenic forcing, we can better predict future responses of phytoplankton and possibly even fisheries."The Northwest Atlantic location was chosen for the CliVEC study because it is the crossroads between major ocean circulation features like the Gulf Stream and the Labrador Current.Discharges from rivers, seasonal changes in water column density stratification, the freshening of surface waters from melting of the Greenland ice sheet, and other climate-related factors can all alter ocean circulation patterns and affect the strength, timing and location of phytoplankton blooms, potentially decreasing annual primary production and changing ocean biology.Scientific activities during the recent 18-day cruise included collecting water samples from the surface to the ocean floor for a variety of chemical measurements, and sampling to identify the incursion of Labrador Current water into the Gulf of Maine. Instruments were also deployed to measure sea surface temperatures and salinities and to collect data on chlorophyll, oxygen and nitrate levels, and the depth of light transmission for primary productivity.In addition to the CliVEC activities, zooplankton samples were collected for the Census of Marine Zooplankton Project. Standard EcoMon sampling was also done, extending oceanographic and plankton time series that started in the early 1970s. Two observers were aboard to identify and count seabirds, and sightings of northern right whales and other whale species were recorded.

Wednesday, February 24, 2010

Dust in Earth System Can Affect Oceans, Carbon Cycle, Temperatures, and Health

Dust is a powerful thing. Not the stuff that we wipe off the coffee table on a regular basis, but the tiny particles floating around in the earth's atmosphere, which originate primarily from deserts in North Africa and the Middle East.

It can affect the oceans, impact the carbon cycle and even have an effect on global temperature.

Dust, and its impact on our planet, was the focus of a symposium recently at the American Association for the Advancement of Science (AAAS) Annual Meeting, in San Diego, California. The discussion began with a presentation by NSERC-funded researcher Dr. Karen Kohfeld from Simon Fraser University.

Dr. Kohfeld is the leader of the climate, oceans and paleo-environments laboratory at the university. Her research focuses on paleo-climate, or using past climates and geologic data to see how well our current climate models are doing. She invented the Dust Indicators and Records of Terrestrial and Marine Palaeoenvironments (DIRTMAP) database which has been used over the past decade by several modeling groups to test whether their representation of the dust cycle is realistic.

"It has been used to demonstrate that both increases in winds and decreases in vegetation cover were important contributors to the dustiness of the last ice age," she writes.

At the conference, Dr. Kohfeld presented an overview of how dust changes and interacts within the Earth system, as her newer work has focused on the role of dust as a feedback within the Earth system, specifically its relevance to the ocean carbon cycle.

She says dust in the atmosphere is a constant in climate studies, given that it is almost everywhere and has seen significant changes throughout history.

Dr. Kohfeld stresses the importance of the dust cycle because of its impact on the carbon cycle. Dust contains iron and other nutrients essential for many organisms. Dust deposition in oceans, freshwater and terrestrial ecosystems can fertilize these areas, resulting in increased growth of vegetation, which in turn leads to less carbon dioxide in the atmosphere.

"Dust is a really good example of how land, atmosphere and climate are connected," she says.

She adds that she is hoping to create better models for understanding the dust cycle and understanding how changes to it will affect the oceans, the carbon cycle and, ultimately, us.

The symposium, entitled "Dust in the Earth System," also brought up issues of health in relation to the dust cycle.


Monday, February 01, 2010

Sea Level in Israel Has Been Rising and Falling Over the Last 2,500 Years


The sea level in Israel has been rising and falling over the past 2,500 years, with a one-meter difference between the highest and lowest levels, most of the time below the present-day level. This has been shown in a new study supervised by Dr. Dorit Sivan, Head of the Department of Maritime Civilizations at the University of Haifa. "Rises and falls in sea level over relatively short periods do not testify to a long-term trend. It is early yet to conclude from the short-term increases in sea level that this is a set course that will not take a change in direction," explains Dr. Sivan.


The rising sea level is one of the phenomena that have most influence on humankind: the rising sea not only floods the littoral regions but also causes underground water salinization, flooded effluents, accelerated coastal destruction, and other damage.

According to Dr. Sivan, the changing sea level can be attributed to three main causes: the global cause -- the volume of water in the ocean, which mirrors the mass of ice sheets and is related to global warming or cooling; the regional cause -- vertical movement of the earth's surface, which is usually related to the pressure placed on the surface by the ice; and the local cause -- vertical tectonic activity. Seeing as Israel is not close to former ice caps and the tectonic activity along the Mediterranean coast is negligible over these periods, it can be concluded that drastic changes in Israel's sea levels are mainly related to changes in the volume of water.

In the present study, in light of earlier studies, research student Ayelet Toker and Dr. Sivan, set out to examine Israel's sea level over the past 2,500 years, based on data deduced from many coastal archaeological findings. They made a careful selection of findings that have been reliably and accurately dated, and first focused on findings that were excavated by the Antiquities Authority in Acre of the Crusader period. These revealed that the sea level during the Crusader period -- just 800 years ago -- was some 50-90 centimeters lower than the present sea level.

Findings from the same period at Caesarea and Atlit reinforced this conclusion. When additional sites were examined from periods before and after the Crusader period, it was revealed that there have been significant fluctuations in sea level: During the Hellenistic period, the sea level was about 1.6 meters lower than its present level; during the Roman era the level was almost similar to today's; the level began to drop again during the ancient Muslim period, and continued dropping to reach the same level as it was during the Crusader period; but within about 500 years it rose again, and reached some 25 centimeters lower than today's level at the beginning of the 18th century.

"Over the past century, we have witnessed the sea level in Israel fluctuating with almost 19 centimeters between the highest and lowest levels. Over the past 50 years Israel's mean sea level rise is 5.5 centimeters, but there have also been periods when it rose by 10 centimeters over 10 years. That said, even acute ups and downs over short periods do not testify to long-term trends. An observation of the sea levels over hundreds and thousands of years shows that what seems a phenomenon today is as a matter of fact "nothing new under the sun," Dr. Sivan concludes.


Tuesday, January 26, 2010

Bubble Physicist Counts Bubbles in Ocean to Answer Questions About Climate, Sound, Light


The bubbles in your champagne that appear to jump out of your glass and tickle your nose are exhibiting a behavior quite similar to the tiny bubbles found throughout the world's oceans, according to bubble physicist Helen Czerski.


But while the champagne bubbles are likely to raise your spirits, those in the ocean can cause clouds to form and affect the climate.

"Bubbles are little packets of gases that rise or fall and can be carried around as if they're on little conveyor belts," said Czerski, a post-doctoral fellow at the University of Rhode Island Graduate School of Oceanography. "They carry carbon dioxide and oxygen from the atmosphere down into the ocean, and then when they go back up again they pop and sulfur compounds from marine plants are sent upward, forming particles in the air that lead to the formation of clouds."

Czerski is studying how to detect and count ocean bubbles of different sizes to help scientists in other disciplines create more accurate models. She said that scientists have found it difficult to judge the effect of bubbles on their data for years and usually have had to add a "fudge factor" to account for them.

"For instance, bubbles ring like bells when they are formed or when sound waves go past them, and if you're studying sounds traveling through the ocean -- like sounds from whales or sonar -- bubbles can get in the way of what you're trying to listen for," said Czerski, who earned a Ph.D. from Cambridge University before spending a year studying bubbles at Scripps Institution of Oceanography in San Diego and then moving to URI.

"Bubbles also scatter light strongly in the oceans and make things cloudy, so if you're studying light in the ocean you need to understand bubbles," she added.

The URI scientist uses an acoustical resonator to detect and count bubbles of different sizes in the water column. The device can detect bubbles from 3 to 170 microns in size, and she is assessing the accuracy and uncertainty in the measurements.

She recently used the resonator to collect bubble data near the Hawaiian Islands and in the Santa Barbara Channel off Southern California. She counts bubbles down to 10 meters deep -- most bubbles don't go down much further than that, she said. The big ones float back to the surface while the smallest ones gets squeezed out by the pressure as they sink.

"Just after a wave breaks, there are loads of bubbles and they're changing really, really quickly," Czerski explained. "They're stretching and squishing and bumping into each other and breaking into smaller bubbles and they're doing it all too fast for us to see directly. Whenever they break up, each new bubble makes a 'ping' sound, and if you hear it you can say something about those new bubbles."

Czerski said that understanding the physics of bubbles is increasingly important as climate models become more and more refined.

"We need to study bubble distribution and where they go in the water column to understand the exchange of gases that they carry," she said.

According to Czerski, while carbon dioxide and oxygen get carried into the ocean via bubbles, a chemical compound produced by phytoplankton gets carried out of the ocean via bubbles.

"No one really knows why phytoplankton create dimethyl sulfide, but they do, and it passes into bubbles and is carried up and out," she said. "These bubbles supply sulfur to the atmosphere, which acts as a seed for cloud droplets to form.

"Climate is made up of a whole bunch of little things, including bubbles, and these little things matter because there are lots of them," Czerski said.

Czerski began studying bubbles after earning a Ph.D. in a field she described as "blowing things up," which included becoming expert at high-speed photography. She then looked for disciplines in which she could apply this knowledge.

"I've always been fascinated by small things that do stuff that's too fast for us to see," she said. "And I like building experiments that help us see those things."

She learned to scuba dive in order to deploy instruments for measuring bubbles, and she now believes that getting in the water is a vital step for any aspiring bubble scientist.

"You can't really understand what's going on under the sea unless you go there yourself," Czerski concluded. "There is a huge benefit to directly experiencing the world you're studying. The rules are different down there."


Monday, January 18, 2010

Wilder Weather Exerts a Stronger Influence on Biodiversity Than Steadily Changing Conditions


An increase in the variability of local conditions could do more to harm biodiversity than slower shifts in climate, a new study has found.


Climate scientists predict more frequent storms, droughts, floods and heat waves as the Earth warms. Although extreme weather would seem to challenge ecosystems, the effect of fluctuating conditions on biodiversity actually could go either way. Species able to tolerate only a narrow range of temperatures, for example, may be eliminated, but instability in the environment can also prevent dominant species from squeezing out competitors.
"Imagine species that have different optimal temperatures for growth. In a fluctuating world, neither can get the upper hand and the two coexist," said Jonathan Shurin, an ecologist at the University of California, San Diego who led the project. Ecologists have observed similar positive effects on populations of organisms as different as herbacious plants, desert rodents, and microscopic animals called zooplankton.
Now a study of zooplankton found in dozens of freshwater lakes over decades of time has revealed both effects. Shurin and colleagues found fewer species in lakes with the most variable water chemistry. But lakes with the greatest temperature variations harbored a greater variety of zooplankton, they report in the journal Ecology Letters January 21.
Their study considered data from nine separate long-term ecological studies that included a total of 53 lakes in North America and Europe. In addition to sampling zooplankton, scientists had also taken physical measurements repeatedly each season for periods ranging from 3 to 44 years.
From these data, they calculated the variability of 10 physical properties, including pH and the levels of nutrients such as organic carbon, phosphorous and nitrogen. Temperatures and the amount of oxygen dissolved in the water at both the surface and bottom of each lake were also included. The authors also teased apart variation based on the pace of change with year-to-year changes considered separately from changes that occurred from season-to-season or on more rapid timescales.
Zooplankton populations respond quickly to changes because they reproduces so fast. "In a summer, you're sampling dozens of generations," Shurin said. "For mammals or annual plants, you would have to watch for hundreds or thousands of years to see the same population turnover."
At every time scale the pattern held: Ecologists found fewer species of zooplankton in lakes with fluctuating water chemistry and greater numbers of species in those with varying temperatures. The authors noted that the temperature variations they observed remained within normal ranges for these lakes. But some chemical measures, particularly pH and levels of phosphorous, strayed beyond normal limits due to pollution and acid rain.
Environmental variability through time could either promote or reduce biodiversity depending on the pace and range of fluctuations, the authors suggested.
"It may depend on the predictability of the environment. If you have a lot of violent changes through time, species may not be able to program their life cycles to be active when conditions are right. They need the ability to read the cues, to hatch out at the right time," Shurin said. "If the environment is very unpredictable, that may be bad for diversity, because many species just won't be able to match their lifecycles to that."
Shurin's 10 co-authors include scientists from environmental agencies in Canada, and universities and research institutes in Canada, Germany, Switzerland and the United States. The Natural Sciences and Engineering Research Council of Canada supported Shurin's work on this study.

Sunday, January 17, 2010

Wilder weather exerts a stronger influence on biodiversity than steadily changin

An increase in the variability of local conditions could do more to harm biodiversity than slower shifts in climate, a new study has found.

Climate scientists predict more frequent storms, droughts, floods and heat waves as the Earth warms. Although extreme weather would seem to challenge ecosystems, the effect of fluctuating conditions on biodiversity actually could go either way. Species able to tolerate only a narrow range of temperatures, for example, may be eliminated, but instability in the environment can also prevent dominant species from squeezing out competitors.

"Imagine species that have different optimal temperatures for growth. In a fluctuating world, neither can get the upper hand and the two coexist," said Jonathan Shurin, an ecologist at the University of California, San Diego who led the project. Ecologists have observed similar positive effects on populations of organisms as different as herbacious plants, desert rodents, and microscopic animals called zooplankton.

Now a study of zooplankton found in dozens of freshwater lakes over decades of time has revealed both effects. Shurin and colleagues found fewer species in lakes with the most variable water chemistry. But lakes with the greatest temperature variations harbored a greater variety of zooplankton, they report in the journal Ecology Letters January 21.

Their study considered data from nine separate long-term ecological studies that included a total of 53 lakes in North America and Europe. In addition to sampling zooplankton, scientists had also taken physical measurements repeatedly each season for periods ranging from 3 to 44 years.

>From these data, they calculated the variability of 10 physical properties, including pH and the levels of nutrients such as organic carbon, phosphorous and nitrogen. Temperatures and the amount of oxygen dissolved in the water at both the surface and bottom of each lake were also included. The authors also teased apart variation based on the pace of change with year-to-year changes considered separately from changes that occurred from season-to-season or on more rapid timescales.

Zooplankton populations respond quickly to changes because they reproduces so fast. "In a summer, you're sampling dozens of generations," Shurin said. "For mammals or annual plants, you would have to watch for hundreds or thousands of years to see the same population turnover."

At every time scale the pattern held: Ecologists found fewer species of zooplankton in lakes with fluctuating water chemistry and greater numbers of species in those with varying temperatures. The authors noted that the temperature variations they observed remained within normal ranges for these lakes. But some chemical measures, particularly pH and levels of phosphorous, strayed beyond normal limits due to pollution and acid rain.

Environmental variability through time could either promote or reduce biodiversity depending on the pace and range of fluctuations, the authors suggested.

"It may depend on the predictability of the environment. If you have a lot of violent changes through time, species may not be able to program their life cycles to be active when conditions are right. They need the ability to read the cues, to hatch out at the right time," Shurin said. "If the environment is very unpredictable, that may be bad for diversity, because many species just won't be able to match their lifecycles to that." Shurin's 10 co-authors include scientists from environmental agencies in Canada, and universities and research institutes in Canada, Germany, Switzerland and the United States. The Natural Sciences and Engineering Research Council of Canada supported Shurin's work on this study.

Wednesday, January 13, 2010

New Method of Measuring Ocean Carbon Dioxide Uptake Could Lead to Climate Change 'Early Warning System'


An international team of scientists led by the University of East Anglia (UEA) has developed a new method of measuring the absorption of CO2 by the oceans and mapped for the first time CO2 uptake for the entire North Atlantic.


Published December 4 in the journal Science, the peer-reviewed study will greatly improve our understanding of the natural ocean 'sinks' and enable more accurate predictions about how the global climate is changing.
The new technique could also lead to the development of an 'early-warning system' to detect any weakening of the ocean sinks -- seen by some scientists as the first signal of more pronounced climate change.
Led by Prof Andrew Watson of UEA's School of Environmental Sciences, the researchers used a network of commercial ships carrying chemical sensors in their engine rooms -- combined with other information such as satellite observations of sea surface temperature -- to map the uptake of atmospheric CO2 by the entire North Atlantic Ocean.
The results suggest that the North Atlantic absorption of CO2 varies substantially over periods of several years and is sensitive to regional changes in climate.
"These exciting results from our new coordinated network represent the first time scientists have observed CO2 uptake over any large region of the world -- either land or ocean -- with such accuracy," said Prof Watson.
"Our new method estimates the flux and how it varies from year to year and season to season, showing patterns of uptake with a detail never before realised."
It is hoped that similar networks could be established in other major ocean basins well-covered by shipping, making it possible to observe carbon uptake over most of the world's oceans. The networks could be used to give early warning of any weakening in the uptake of carbon dioxide by the global oceans. This uptake is very important in slowing the rise of CO2 in the atmosphere, and some scientists have warned that such a weakening of the sink could be beginning to occur as climate change becomes more pronounced.

Melting Tundra Creating Vast River of Waste Into Arctic Ocean


The increase in temperature in the Arctic has already caused the sea-ice there to melt. According to research conducted by the University of Gothenburg, if the Arctic tundra also melts, vast amounts of organic material will be carried by the rivers straight into the Arctic Ocean, resulting in additional emissions of carbon dioxide.


Several Russian rivers enter the Arctic Ocean particularly in the Laptev Sea north of Siberia. One of the main rivers flowing into the Laptev Sea is the Lena, which in terms of its drainage basin and length is one of the ten largest rivers in the world. The river water carries organic carbon from the tundra, and research from the University of Gothenburg shows that this adds a considerable amount of carbon dioxide to the atmosphere when it is degraded in the coastal waters.
Increased temperatures
The increase in temperature in the Arctic, which has already made an impact in the form of reduced sea-ice cover during the summer, may also cause the permafrost to melt. "Large amounts of organic carbon are currently stored within the permafrost and if this is released and gets carried by the rivers out into the coastal waters, then it will result in an increased release of carbon dioxide to the atmosphere," says Sofia Hjalmarsson, native of Falkenberg and postgraduate student at the Department of Chemistry.
Study of two areas
In her thesis, Sofia Hjalmarsson has studied the carbon system in two different geographical areas: partly in the Baltic Sea, the Kattegat and the Skagerrak, and partly in the coastal waters north of Siberia (the Laptev Sea, the East Siberian Sea and the Chukchi Sea). The two areas have in common the fact that they receive large volumes of river water containing organic carbon and nutrients, mainly nitrogen.
The thesis Carbon Dynamics in Northern Marginal Seas was publicly defended on 18 December.

Saturday, January 09, 2010

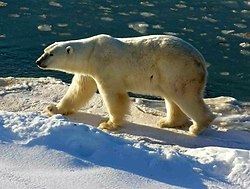
Polar bears in southern Beaufort Sea spending more time on land and open water


A long-term study showing the changes in habitat associations of polar bears in response to sea ice conditions in the southern Beaufort Sea has implications for polar bear management in Alaska.

Karyn Rode, a polar bear biologist with the U.S. Fish and Wildlife Service in Anchorage, Alaska and one of the study's authors, says data collected between 1979 and 2005 show that polar bears in the region are occurring more frequently on land and in open water and less frequently on ice during the fall. This means there are increased chances for human/bear interaction. The paper was published in the December issue of Arctic – the journal of the Arctic Institute of North America.

Polar bears were observed over the 27-year period by U.S. government Minerals Management Services staff as part of the fall bowhead whale aerial survey conducted annually in the southern Beaufort Sea. Ice conditions were also recorded.

Data showed that as ice conditions changed, bears were being found on different habitats. Between 1979 and 1987, 12% of bear sightings were associated with no ice. Between 1997 and 2005 however, 90% of bear sightings were associated with no ice.

"When bears were seen, they were more often seen in open water and on land than on sea ice. At the same time, changes were observed in ice, suggesting that these observations are connected," says Rode.

In addition, the number of bears sighted steadily increased from 138 bears in the years 1979-1987, to 271 bears between 1988 and 1996, and finally to 468 bears between 1997 and 2005. Rode warns that this study was not designed to estimate the number of bears using the nearshore area. Data were drawn from studies created to track bowhead whale migration routes, not polar bear populations. Therefore, it should not be concluded that more bears are occurring in the nearshore waters off the Southern Beaufort Sea coast.

However, Rode states that "Our results do suggest that bears that use the nearshore area are more likely to occur on land in recent years because their preferred habitat, sea ice, is unavailable.

"This is one of the few data sets available over such a long time frame. It shows there has been a shift in habitat use," she says.

In the Beaufort Sea region, there was less ice in 2005 than when the study period began in 1979. In general, freeze up is later and spring melt comes earlier with measurements showing since 1979 the summer melt period has increased by 13 days per decade. This is one reason for the region's rapid retreat of multi-year ice, which provides a thicker, more stable platform for hunting and denning.

This work is helpful in highlighting the need to proactively develop programs to manage bear-human interactions in coastal areas. Bear-human interactions in Native villages and with industry in Alaska have been on the rise in recent years.

###
This media release is part of the Promotion of Arctic Science, an Arctic Institute of North America project made possible with the generous support of the Government of Canada Program for International Polar Year.

The mission of the Arctic Institute of North America at the University of Calgary is to advance the study of the North American and circumpolar Arctic and to acquire, preserve and disseminate information on physical, environmental and social conditions in the North. More information can be found at www.arctic.ucalgary
.ca